
|
Agreement Operations and Performance Dashboard
Navigation from your Home screen:
 >
>  or
or 
Your employee role must have the View Dashboard, Operations, and Performance permissions to view operations and performance information. See "Roles & Permissions" for more information.
On the Search Open or Agreement tabs on the Home page, access instant agreement statistics for your current location (selected at the top of TSD DEALER), including status breakdowns, length of use (LOU), and more. See "Operations & Performance Dashboards Overview" for a general overview of Operations and Performance information.
To view a tutorial for this topic from the web application, click the Tutorials icon ( ), or to view a list of available tutorials.
Agreement Operations
Navigation from your Home screen:
>
The Agreement Operations dashboard displays a snapshot of all vital agreement information in one place.
View Agreement Statuses
You can view a breakdown of agreement statuses at your current location. By default, agreements of all types are shown, but you can use the All Types list to narrow by certain types of agreements (i.e., Rental).
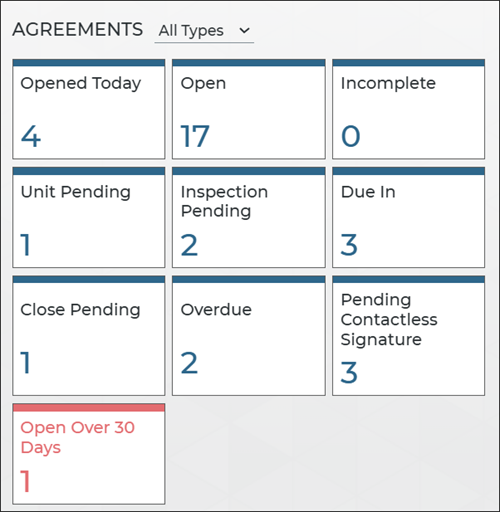
Hover to view the full-sized image.
Click a status tile to view a list of applicable records on the Agreement Hub. The following agreement status tiles are available:
- Opened Today: Open and Closed agreements that were opened today.
- Open
- Incomplete
- Unit Pending
- Due In
- Overdue
- Open Over 30 Days or Open Over X Days. Agreements currently open, that have been open for over 30 days, or another specified number of days, based on the Opened Over (Days) management setting. For example, if set to 15, then this metric will be Open Over 15 Days. Open Over 30 Days is shown in red if the value is greater than 0.
- Pending Contactless Signature, or open agreements that are pending a remote signature from the customer. See "Contactless Agreements: Remote Signatures" for more information.
- MDL Returns, available for locations with MDL autoMation™ Integration to track open agreements with a detected unit return. See "MDL autoMation Integration" for more information.
- Invoiced ROs, available for locations with Reynolds Integration to track invoiced customer repair orders. See "Reynolds and Reynolds Integration" for more information.
Key Statuses to Monitor
Overdue & Open Over 30 Days. How many agreements are overdue? How many agreements been open for more than 30 days? Update the Expected Return Date on these agreements, as necessary, based on your repair orders.
To help draw your attention to agreements that have been opened too long, the Open Over 30 Days metric is shown in red if the value is greater than 0.
Pending Contactless Signature. How many agreements still require a contactless signature to be submitted by the customer? Keep lines of communication open with the customer and send a reminder to submit a signature.
Filter Statuses by Type of Agreement
If your location has a rental service enabled in Agreement Types, a filter is available for you to narrow the status breakdown by:
- All Types (selected by default), to view statuses for all types of agreements available at your location, including Rental, Internal Use, Shuttle, Third Party, as well as voided agreements.
- Loaner, to view statuses for Loaner agreements only, including voids
- Rental, to view statuses for Rental agreements only, including voids
- Subscription, to view statuses for Subscription agreements only, including voids
- Loyalty, to view statuses for Loyalty agreements only, including voids
Agreement Performance
Navigation from your Home screen:
>
The agreement performance dashboard shows key agreement metrics for your current location, such as agreement Length of Use (LOU), how fast your employees open and close agreements, and the total number of agreements opened and closed.
Use the 30, 60, 90, or 120 options to indicate the number of days for which you want to view performance. See "Glossary of terms" in this topic for information on individual performance metrics.
Glossary of terms
Agreements Per Day
On your Agreements Performance dashboard, this is the average number of new agreements created (opened) per day during your selected reporting period (30, 60, 90, or 120 days). Internal Use agreements are not included in this metric.
Appointments Per Day
On your Appointments and Agreements Performance dashboards, this is the average number of new appointments created (booked) each day during your selected reporting period (30, 60, 90, or 120 days).
Length of Use (LOU)
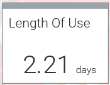
Length of Use (LOU) is the average length, in days (rounded to two decimal places), of agreements that were closed during a given period.
![]() Where can I find my location's LOU?
Where can I find my location's LOU?
How can I lower my LOU to the recommended value of 2.5 days (over 90 days)?![]()
Miles Per Agreement
On your Agreements Performance dashboard, this is the average number of miles accrued by units on agreements, during your selected reporting period (30, 60, 90, or 120 days). Internal Use agreements are not included in this metric.
RO Invoiced to Close
This metric is only available on systems with Reynolds and Reynolds integration. See "Reynolds and Reynolds Integration".
Use this metric to keep track of how long it takes your employees, on average, to close agreements after TSD DEALER receives an invoiced RO from your Reynolds and Reynolds DMS.
This metric uses the invoiced date and time (stored behind-the-scenes), as well as the actual date and time the agreement was closed (not the Return Date / Time).
Third Party Per Day
On your Agreements Performance dashboard, if your location uses a Third Party service, this is the average number of Third Party agreements, or agreements in which a unit is provided by a third party, created at the location per day, during your selected reporting period (30, 60, 90, or 120 days).
Time To Close
On your Agreements Performance dashboard, this is the average length of time (minutes and seconds) employees have spent closing an agreement during your selected reporting period (30, 60, 90, or 120 days). Internal Use agreements are not included in this metric.
Time To Open
On your Agreements Performance dashboard, this is the average length of time (minutes and seconds) employees have spent opening an agreement during your selected reporting period (30, 60, 90, or 120 days). Internal Use agreements are not included in this metric.
Total Opened
On your Agreements Performance dashboard, this is the total number of agreements opened at the location during your selected reporting period (30, 60, 90, or 120 days), separated into those opened on the web application and on the mobile app. Internal Use agreements are not included in this metric.
Total Closed
On your agreements performance dashboard, this is the total number of agreements closed at the location (excluding reopened and voided agreements), separated into agreements closed on the web application and on the mobile app. Internal Use agreements are not included in this metric.
© 2026 TSD Rental, LLC